Table of Contents
Get Started with Manager Panel
 Updated
by The Cooleaf Success Team
Manager Panel is an analytical tool that provides a snapshot of your team's engagement level on Cooleaf's platform. Here, users with admin or local admin level accounts can quickly evaluate individual and team performance and adherence to core values.
Manager Panel gives supervisors access to platform analytics such as:
- Rewards budget
- Participation rate
- Recognitions (given/received)
- Redemptions
- And more...
*Manager Panel availability for local admin account status depends on your organization's account settings
How to Access Manager Panel
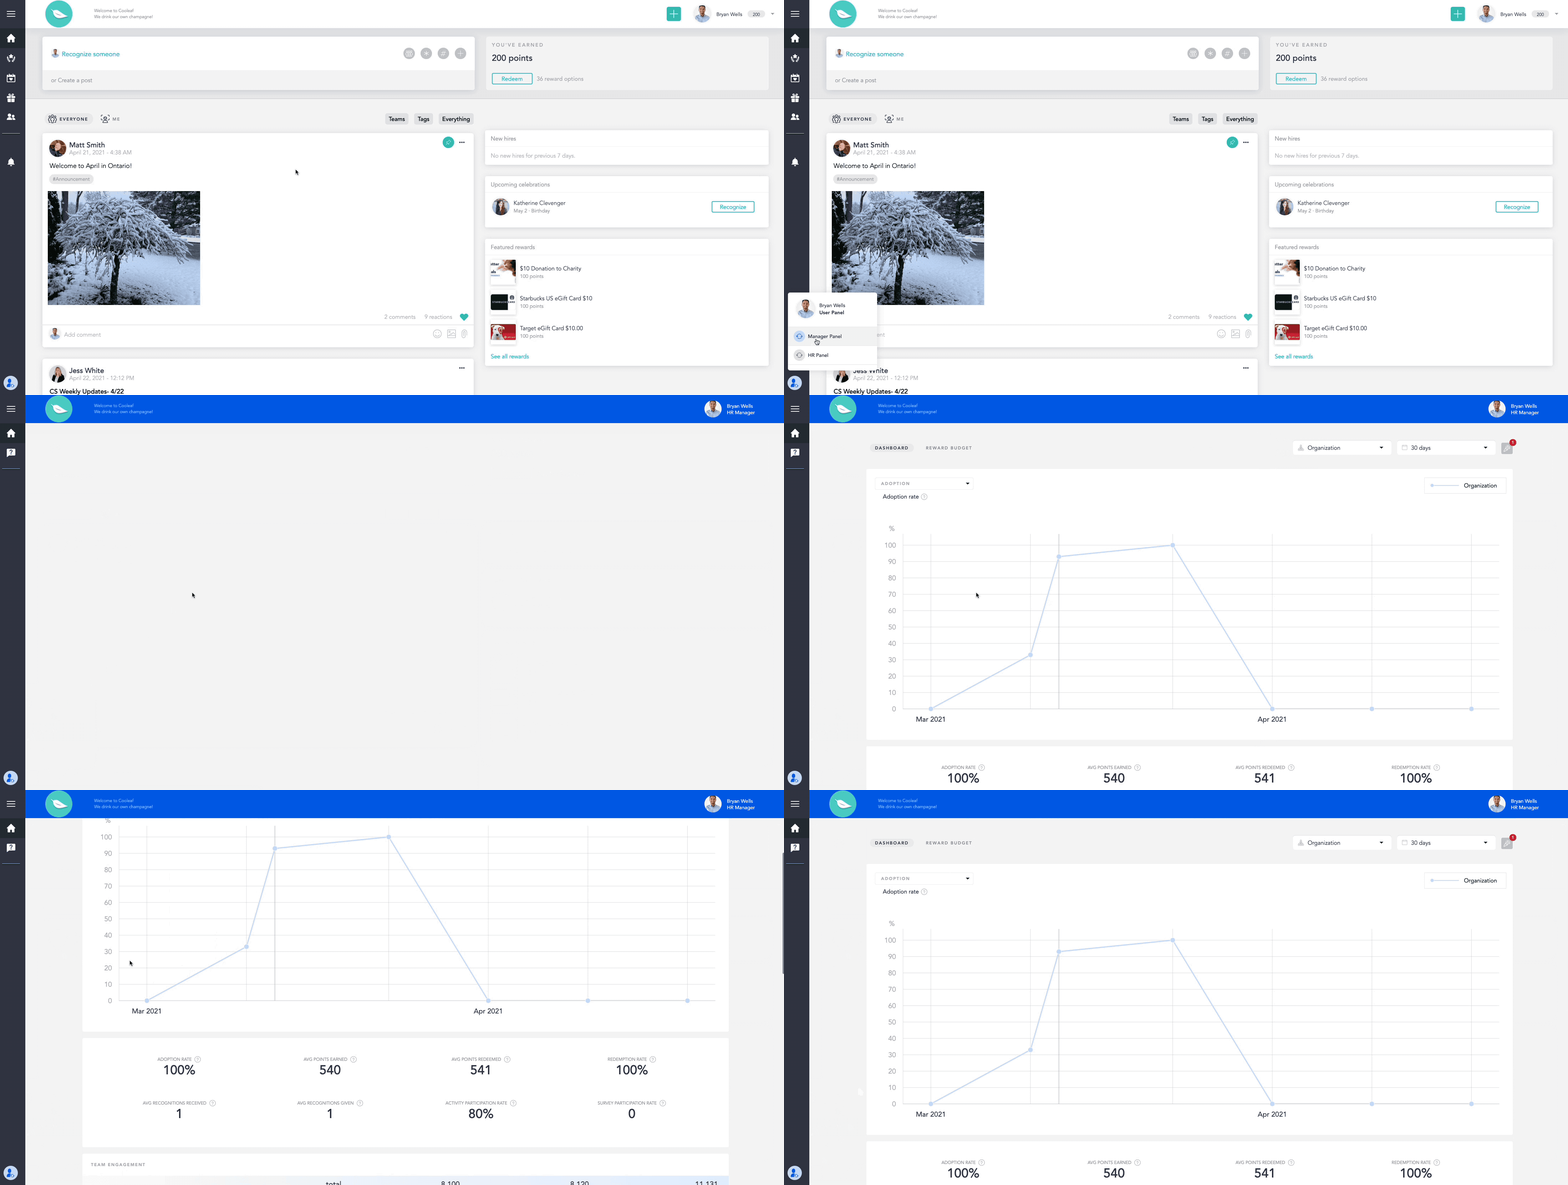
Start at Cooleaf's User Panel page.
- Navigate to the silhouette icon at the bottom left of the web platform, and select "Manager Panel."
- Welcome to Manager Panel!

Adjust Your Line Graph
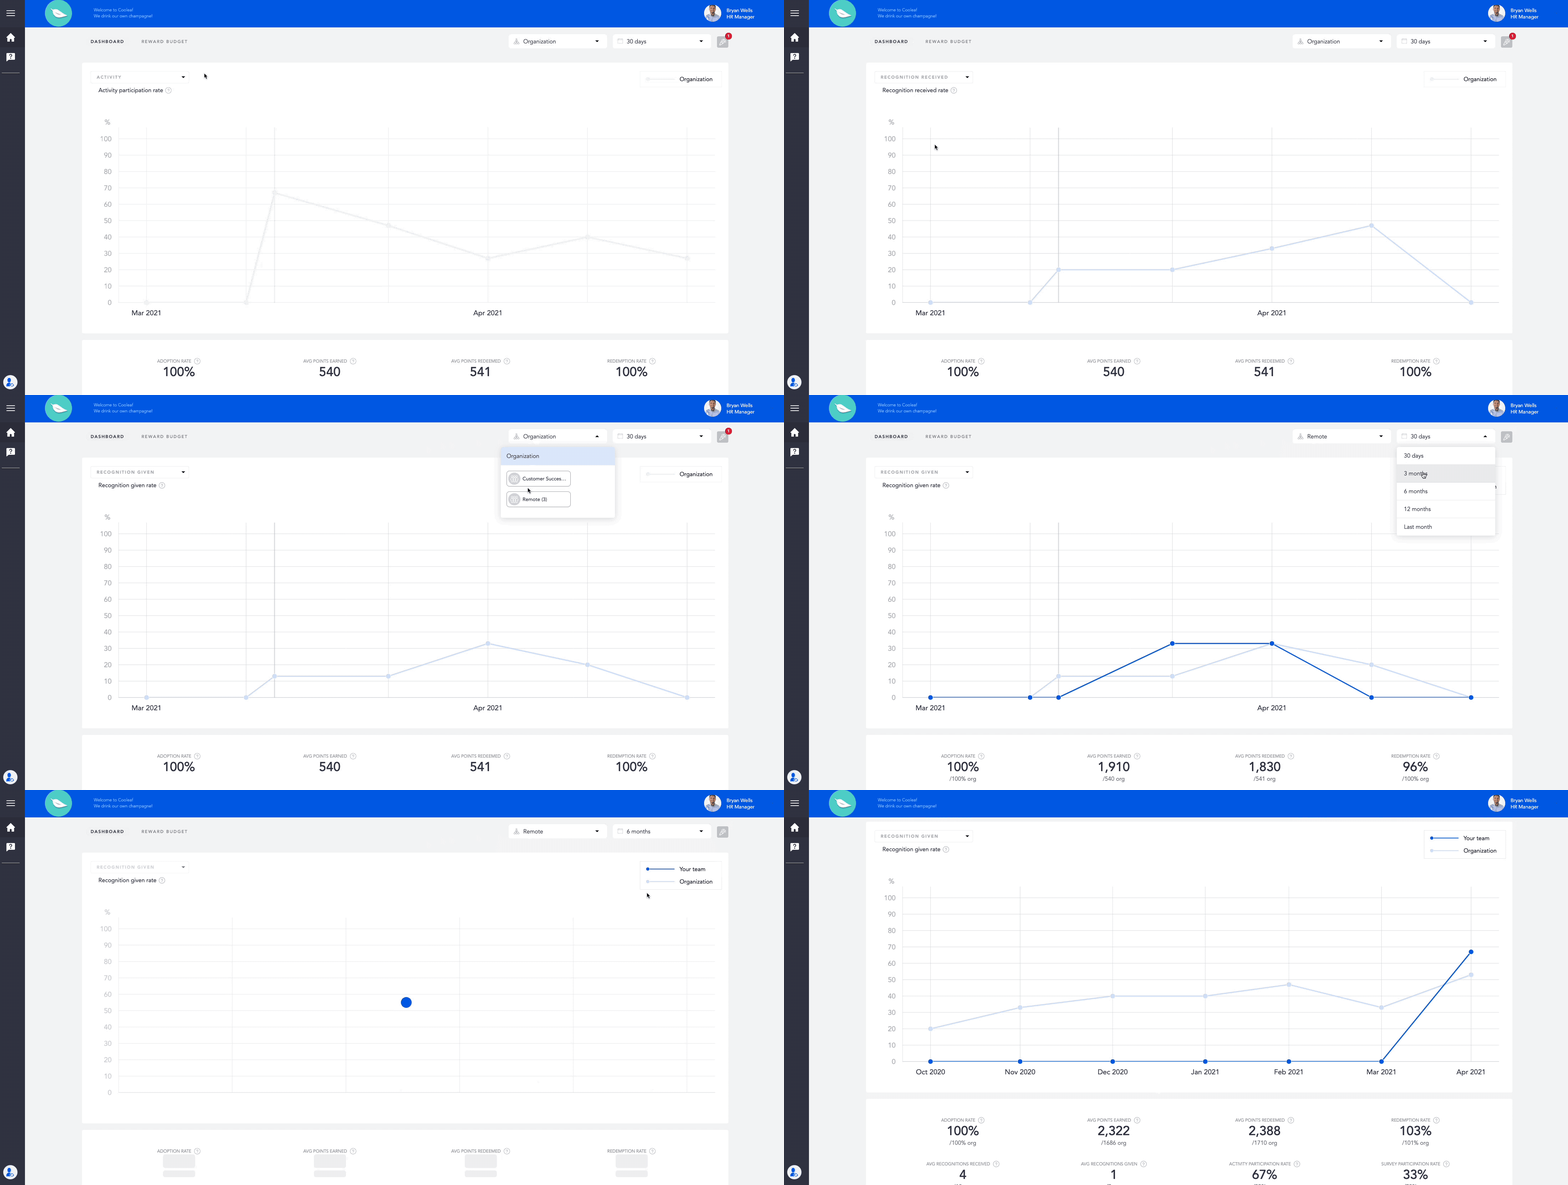
The line graph provides a customizable chart that captures critical engagement analytics at a glance. Displayed data derives from three categories: desired metric, organizational structure (or population), and time.
Adjust your categories to set your desired outcome:
- Choose the metric to be measured from the drop-down list found at the top left corner of the line graph chart
- Choose the population(s) from the drop-down list found at the top right corner of the page above the line graph
- Managers will be able to see their direct reports
- Admin-level accounts will be able to select tags and/or the entire organization. The default will land you on your Teams view first.
- Choose your date range from the drop-down list found at the top right corner of the page above the line graph

Understand Your Metrics
Metrics are one of the key performance indicators (KPI's) designed to track platform effectiveness, productivity, and value added. As the categories are adjusted, the calculation for each metric displays the newly specified dataset.
Available metrics include:
- Adoption Rate (Quarterly Goal: >65% for non-onboarding organizations)
- This metric shows what percentage of users have completed registration, logged onto the platform and completed an action in the platform (Actions include: giving recognition, joining a challenge, liking, commenting, completing a survey, or redeeming points.)
- Average Points Earned/Redeemed
- This metric shows the average of users' points earned/redeemed on the platform, inclusive of challenges, automated and manual recognitions, surveys, etc.
- Redemption Rate (Quarterly Goal: >70% for non-onboarding organizations)
- This metric shows the percentage of points redeemed versus earned.
- Average Recognitions Received/Given
- This metric shows the average amount of recognitions given or received during the selected time frame.
- Activity Participation Rate (Quarterly Goal: >28% for non-onboarding organizations)
- This metric shows what percentage of users participated in an event or challenge in the specified date range.
- Survey Participation Rate (Quarterly Goal: >50% for non-onboarding organizations)
- This metric shows what percentage of users participated in a survey in the specified date range.

Review Your Usage
A complete breakdown of each metric is available for further analysis. Get macro and micro analysis of program strengths & weaknesses, budget allocation, and identify high-performing team members.
Available analysis includes:
- Team Engagement
- Recognitions
- Activity
- Awards (Core Values & more)

Want to learn more?
- Take a peek at our pulse surveying tool & strategy, also available in Manager Panel (admin level)
- Dive deeper into statistics and reporting through the HR Panel (admin level)
- Review our Manage Cooleaf Support section (admin level) for additional resources
More questions? View our extensive Support Center here or contact exsupport@itagroup.com.
